As 2024 draws close, it’s the perfect time to review the year’s advertising performance, focusing on key metrics such as ad spend, cost-per-click (CPC), and Advertising Cost of Sale (ACOS). The year was marked by impactful events, from Valentine’s Day and Easter in the spring to Prime Day in the summer and back-to-school campaigns in the fall. Major Q4 events like Black Friday, Cyber Monday, and Christmas fueled a surge in advertising, while smaller occasions like Labor Day and Halloween kept brands actively engaged throughout the year. These events underscored how advertisers maintained their competitiveness and relevance in a dynamic marketplace.
Here’s a breakdown of the trends that shaped 2024 and insights into what lies ahead.
Ad Spend Overview: Peaks, Troughs, and Key Trends
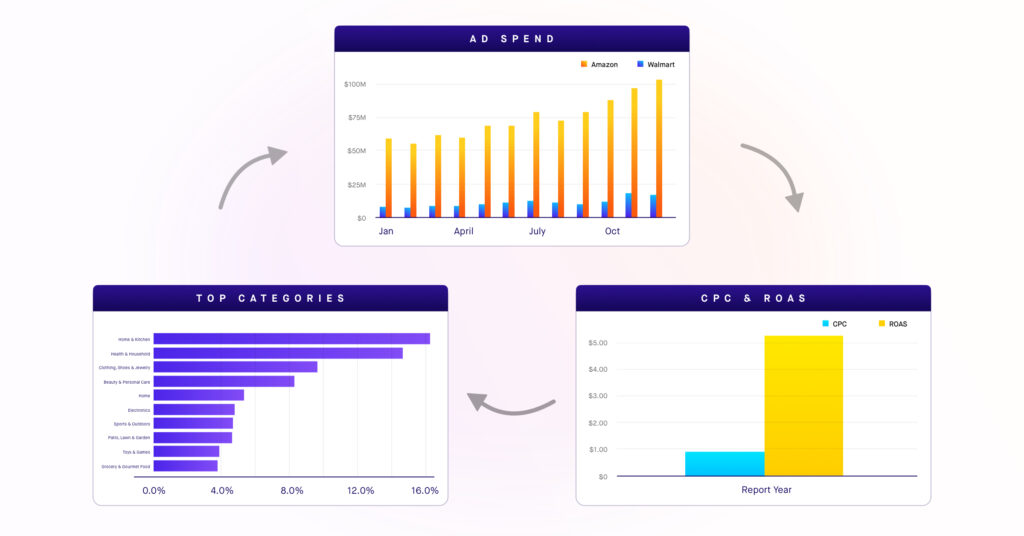
Ad spend in 2024 saw a steady upward trend, with a 23.4% increase overall compared to 2023. Let’s look at the highlights:
- Highest Ad Spend Month:
November saw the year’s highest ad spend, with a 62.8% increase compared to November 2023. The Black Friday and Cyber Monday shopping frenzy fueled this surge, as advertisers heavily invested to capture consumer attention during these critical retail events. - Lowest Ad Spend Month:
February recorded the lowest ad spend, with a 31.8% increase compared to February 2023. The post-holiday lull and reduced consumer activity contributed to lower ad spend in this period as brands recalibrated their strategies for the spring and summer seasons.
CPC and ACOS Analysis: Monthly Trends and Insights
CPC and ACOS provide valuable insights into advertising efficiency and competition. Here’s how these metrics played out in 2024:
- Highest CPC Month:
July recorded the highest CPC, $0.96, at 10.4% higher than July 2023. Increased competition during summer sales and seasonal demand led to bidding wars, pushing CPC upward. - Lowest CPC Month:
Walmart saw the lowest CPC in January $0.81, with a 27.5% increase compared to January 2023. The quieter post-holiday period contributed to this cost efficiency, as competition for ad space was relatively low. - Highest ACOS Month:
September experienced the highest ACOS, 20.5%, 12.0% higher than September 2023. The back-to-school season saw heightened competition, which, combined with lower conversion rates, led to increased costs per sale. - Lowest ACOS Month:
Walmart achieved its lowest ACOS in February, 18.1%, reflecting an 8.6% decrease compared to February 2023. Lower competition during this period allowed Walmart to optimize its advertising spend efficiently.
Amazon vs. Walmart: Ad Spend Insights
Both Amazon and Walmart showed strong performances in 2024, with each platform demonstrating distinct trends in ad spend.
Amazon’s Top Month for Ad Spend: December was Amazon’s top month for ad spend, with an impressive 18.3% increase compared to December 2023. The end-of-year holiday shopping rush drove this peak, as Amazon sought to capture the lion’s share of consumer attention during the critical holiday period.
Walmart’s Top Month for Ad Spend: Walmart, on the other hand, had its highest ad spend in November, with a 7.8% increase from the same month in 2023. As expected, the Black Friday and Cyber Monday events significantly drove up Walmart’s ad spend during this period.
Both platforms performed solidly in 2024, with Amazon generally seeing higher ad spend, particularly in the latter half of the year. While Amazon dominated the advertising landscape in terms of total spending, Walmart also exhibited strength with more efficient ad spend and lower CPCs, making it a key player in the digital ad space.
Top 3 Categories of 2024: A Look at Performance
2024 saw a variety of categories emerge as top performers, with Home & Kitchen, Health & Household, and Beauty & Personal Care leading the way.
- Home & Kitchen: This category saw steady performance throughout the year, driven by seasonal trends and a consistent demand for home improvement and décor items. With consumers spending more time at home, this category benefited from a steady stream of advertising investment and consumer interest.
- Health & Household: This category experienced growth, particularly during the spring and fall months. With ongoing health concerns and an increasing focus on wellness, products in this category saw strong sales, especially during the peak seasons when health-related products are in high demand.
- Beauty & Personal Care: Beauty and personal care products were consistently in demand in 2024. The growth of skincare and grooming trends and significant product launches contributed to this category’s success. Advertising spend remained high throughout the year, with a spike in the summer and fall months.
Other notable categories included Clothing, Shoes, and jewelry, which performed strongly during key retail events, and Home, which continued to capitalize on evolving consumer preferences.
Conclusion: A Year of Growth and Strategic Spending
2024 was a year of growth and strategic ad spending. The year saw significant fluctuations in ad spend, CPC, and ACOS, with seasonal events like Prime Day, Black Friday, and Cyber Monday driving peaks in spending, particularly for Amazon and Walmart. The year’s top categories reflected shifting consumer priorities, with Home & Kitchen, Health & Household, and Clothing, Shoes & Jewelry taking the lead. As we look ahead to 2025, it’s clear that the e-commerce landscape will continue to evolve, with brands adapting their strategies based on these insights and trends.
Here’s to a successful 2024 and an even more promising 2025!
Ready to unlock the full potential of your advertising strategies? Contact Teikametrics to learn how to use AMC insights to optimize your advertising strategy and drive meaningful business growth.


