As we prepare for the upcoming shopping season, reviewing last year’s Black Friday and Cyber Monday (BFCM) event offers valuable insights for sellers looking to optimize their strategies for 2024. In 2023, BFCM saw considerable shifts in ad spending, cost-per-click (CPC), and Return on Ad Spend (RoAS), reflecting the highly competitive landscape. Here’s a breakdown of last year’s key metrics and insights to help sellers navigate this year’s BFCM season.
Key Highlights and Top Categories
During BFCM 2023, specific categories experienced significant engagement. Grocery & Gourmet Food led with a 19.1% contribution, followed closely by Home & Kitchen at 18.9% and Clothing, Shoes & Jewelry at 11.5%. These categories benefited from the seasonal demand, with many consumers looking for holiday gifts, home goods, and essentials.
Other notable categories included Home (7.5%), Toys & Games (6.8%), and Electronics (5.9%). These categories maintained strong performance, driven by holiday gift shopping and increased interest in home and lifestyle items. This broad demand highlights the need for sellers to ensure inventory and promotional strategies are optimized across multiple high-interest categories.
Pre and Post-Event Ad Spend Analysis
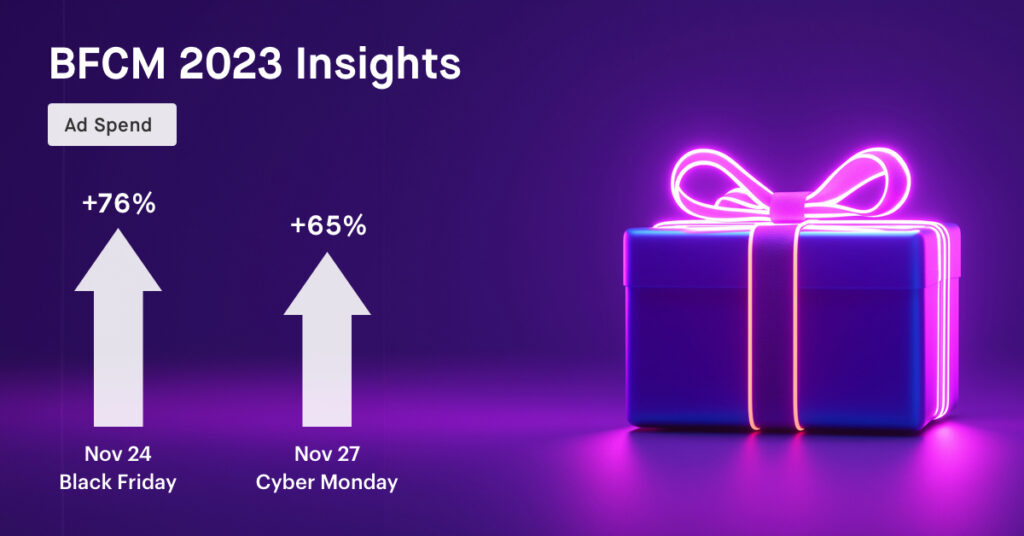
We see substantial increases when analyzing ad spending for Black Friday and Cyber Monday compared to other days in November. On Black Friday, ad spending surged by approximately 76% compared to the average daily spend in November, while Cyber Monday saw a 65% increase. These increases reflect the intensified competition and the high-value audience captured during these peak days.
Also, the period from November 22 to November 27 showed a sustained increase in ad spending, as advertisers aimed to maximize visibility during the entire BFCM weekend. The elevated ad spending suggests that sellers focused on maintaining their brand presence throughout the shopping weekend to capture early and last-minute buyers.
CPC and RoAS Analysis
The cost-per-click (CPC) data indicates a notable rise during BFCM. CPC on Black Friday increased by around 15% compared to the November average, while Cyber Monday saw a similar spike of 18%. This increase aligns with heightened competition as more sellers bid for ad space to reach the high-volume audience during these peak days.
On the other hand, return on Ad Spend (RoAS) decreased during BFCM, with Black Friday and Cyber Monday RoAS dropping by about 8-10% compared to the November average. While the sales were strong, the elevated CPC during BFCM impacted RoAS, underscoring the balance between high traffic and the increased cost of advertising these days. Despite the drop, RoAS remained profitable, reflecting the high customer purchase intent during BFCM.
Key Takeaways for BFCM 2024
- Extended Bidding Strategy: The sustained increase in ad spend in the days surrounding BFCM highlights the importance of an extended bidding approach. Sellers can benefit from allocating more budget for Black Friday and Cyber Monday and the days leading up to and following the event to capture a larger audience.
- Budget Adjustments for CPC Increases: As CPCs are likely to rise during BFCM, allocating a higher budget to cover this increase can ensure continued visibility. Sellers should monitor performance closely to ensure they remain profitable despite the higher costs.
- Category Targeting: Last year, Grocery & Gourmet Food, Home & Kitchen, and Clothing, Shoes & Jewelry were the top-performing categories. Sellers in similar categories should consider targeted promotions and competitive pricing to capitalize on the increased demand during BFCM.
Conclusion
In 2023, Black Friday and Cyber Monday showed the impact of improved ad strategies and focusing on what shoppers want most. Grocery & Gourmet Food, Home & Kitchen, and Clothing were the top categories, driving big sales as customers hunted for deals. We also saw a jump in ad costs, but sellers who kept a close eye on metrics like CPC and ROAS managed to get substantial returns. For the 2024 BFCM, it’s worth planning early—especially by focusing ad budgets on high-demand categories and using customer insights to make ads as relevant as possible. Testing out strategies ahead of time can give you a better sense of what clicks with buyers.
Ready to optimize your ad strategy? Teikametrics’ industry-leading AI can help you navigate these challenges with access to real-time data and precision-driven insights. Elevate your advertising game today—explore how with a free demo webinar!
*The percentage values above represent each category’s share within the overall marketplace during that*


