May 27th, 2026
Alexa for Shopping: What Changes to Rufus Mean for Your Amazon Catalog
When news broke that Amazon was "axing Rufus," it was easy to read it as an admission of failure. But...
Subscribe for the latest insights, data trends, and best practices to grow your ecommerce business.
When news broke that Amazon was "axing Rufus," it was easy to read it as an admission of failure. But...
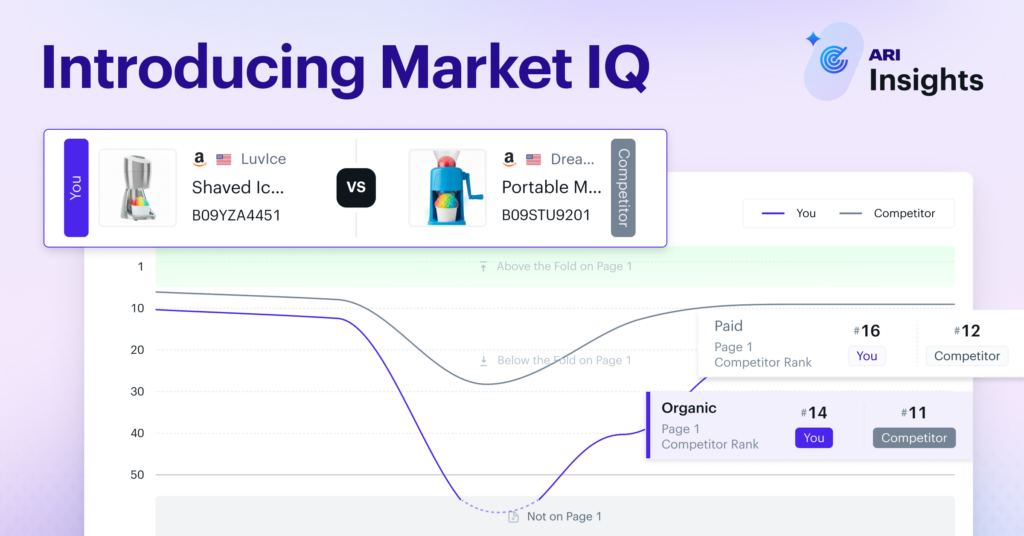
Market IQ is a market-level decision engine for marketplace brands. It unifies your paid, organic, and...

The TikTok halo effect is driving Amazon sales your dashboard can't see. Here's why brands are under-crediting...
Your Amazon business doesn’t have a growth problem. It has a connective-tissue problem — and...

A companion piece to the latest episode of Human in the Loop, the podcast where we argue about how much...
The question isn’t whether TikTok Shop is hot – it’s whether it makes strategic sense for your...
Why Amazon sellers should expand to TikTok Shop. Learn how discovery-driven commerce drives growth—and...
What does this mean for brands? It means that simply listing your products and optimizing keywords (the...
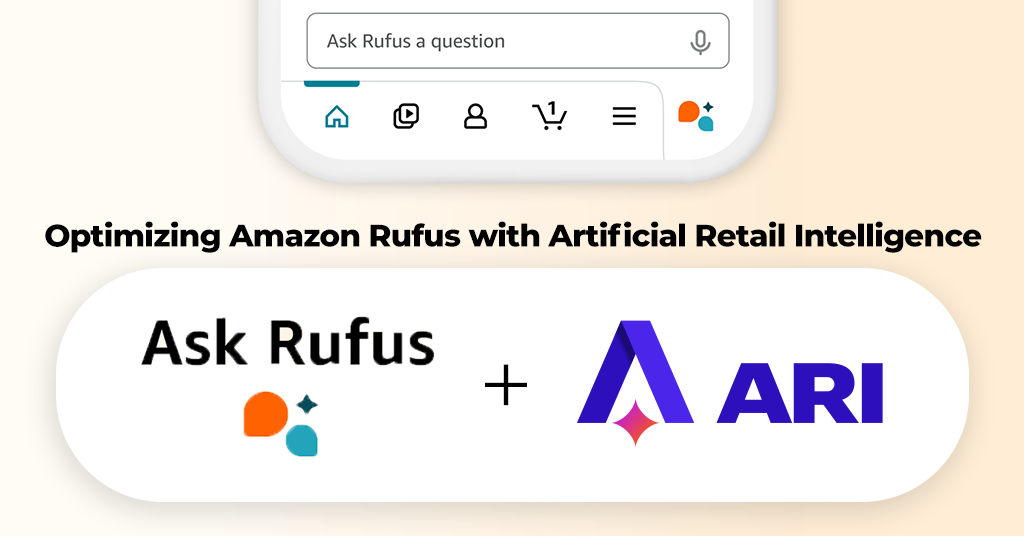
Amazon is rapidly transforming how shoppers discover products and at the center of this shift is Rufus...

Learn why enterprise ecommerce brands choose Teikametrics for Walmart ad optimization, with AI automation...

Learn criteria for selecting an Amazon ad agency near you, including service types, key tools, reporting...

TikTok Shop isn’t just TikTok with a checkout button. It’s a fundamentally different commerce ecosystem—one...
